Recently we have been migrating our pdf generation at work from Prince to Doc Raptor. Doc Raptor has an async flow which will call a web hook when the pdf generation is done. We found that if there is an error generating the pdf Doc Raptor doesn’t call the web hook.
This led to an interesting issue, we were using the webhook so we didn’t need to poll their API, now we need to poll their API on the off chance there is an error.
When looking for possible options to implement the polling I thought about using a SQS delay queue, delaying the message visibility by the polling interval. If the status isn’t completed or failed another message is queued again delaying the message visibility.
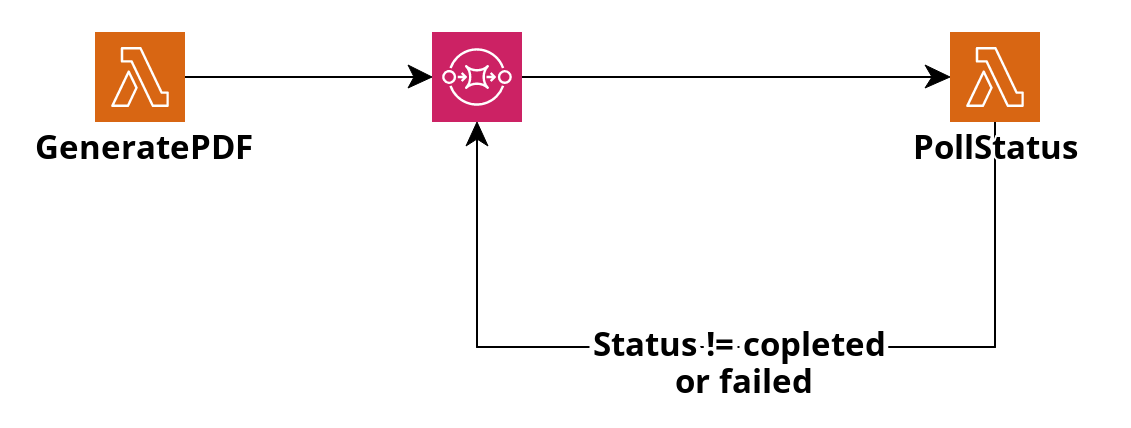
The general flow is below
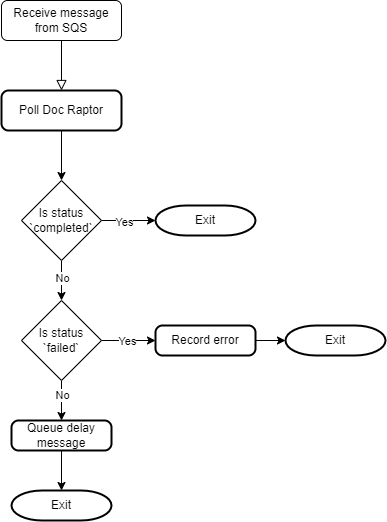
The GeneratePDF posts a message to the queue containing the status_id that Doc Raptor give us to check the status, our export id and the original queue time with delay seconds set to 30 seconds. The poll lambda picks up the message and checks the sataus. If the status is completed the lambda just returns, if the status is failed it records the failed reason and returns. If the status is something else it posts another messag to the queue with same data and another 30 second delay. If we find that we have been polling for more than 15 minutes we raise an error and exit.
Lastly the code to send the delay message is very simple.
Back in last year August we started getting an odd error from the couch-backup lambda. Out of nowhere we started getting error messages like the below.
1
2
3
4
5
6
7
8
{ "message":"EMFILE: too many open files, open '/tmp/couchbackup/couchbackup-f..._2022-08-22T17:30:33.642Z.log'", "stack":"Error: EMFILE: too many open files, open '/tmp/couchbackup/couchbackup-f..._2022-08-22T17:30:33.642Z.log'", "errno":-24, "code":"EMFILE", "syscall":"open", "path":"/tmp/couchbackup/couchbackup-f..._2022-08-22T17:30:33.642Z.log" }
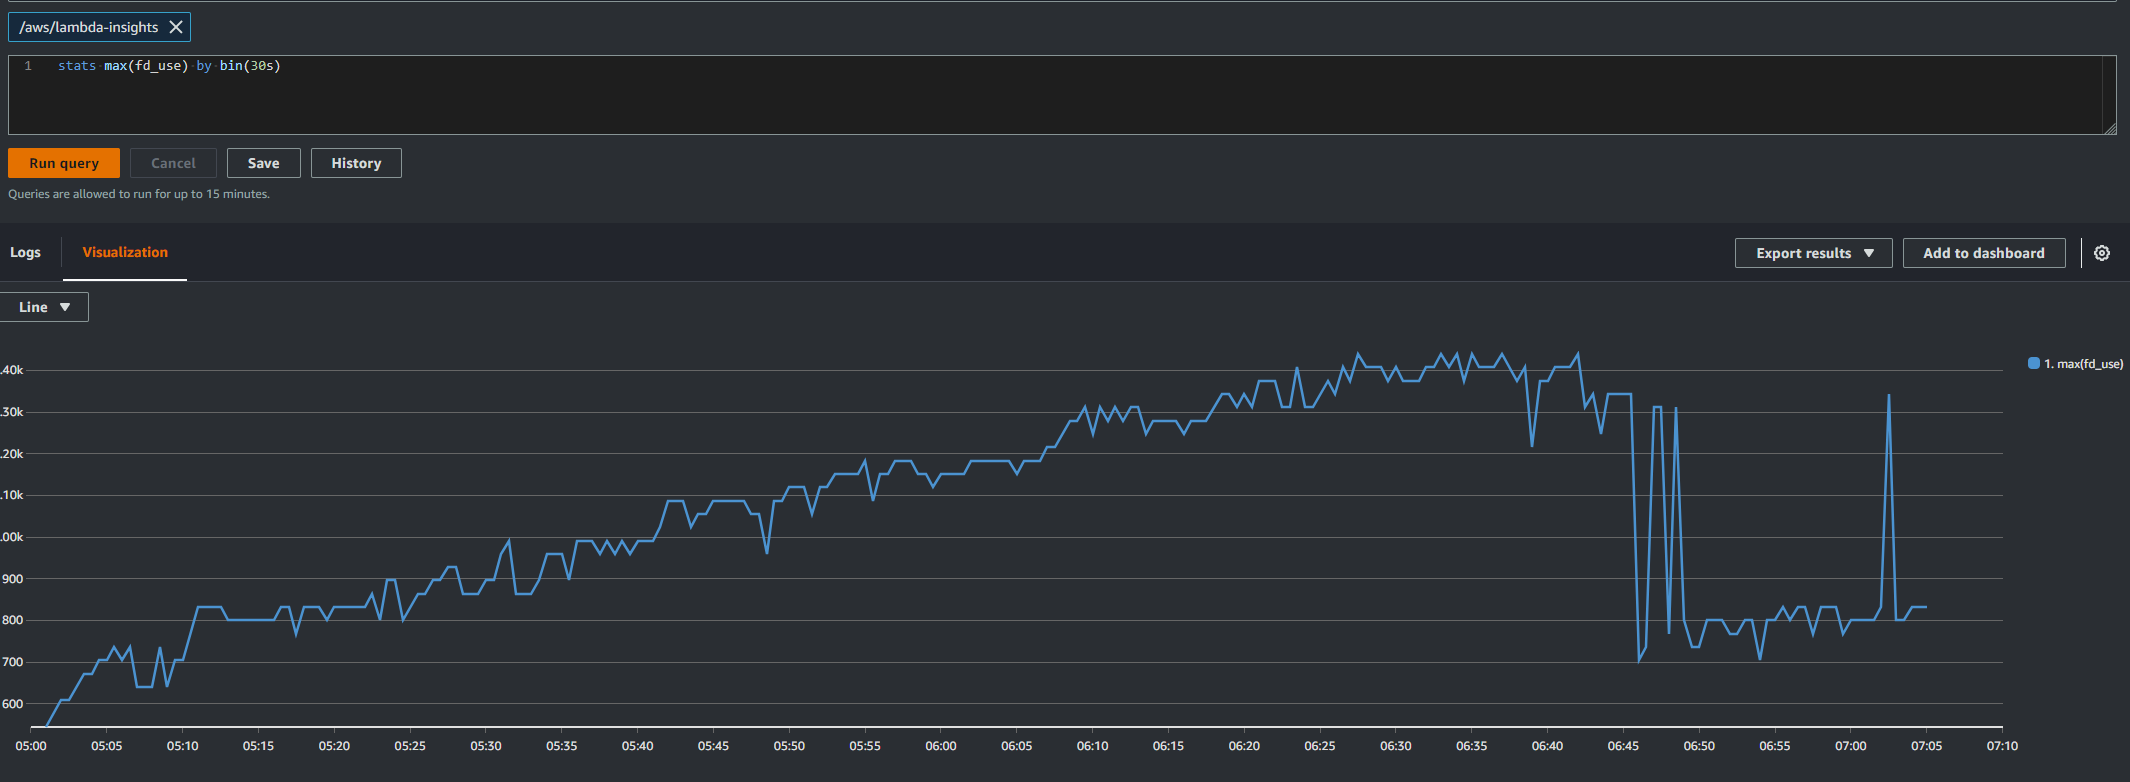
Looking through our code we don’t directly open any files or sockets which would cause this type of issue. We could see that file descriptors where being left open using Lambda Insights.
So, we Googled to see if anyone else had this issue and discovered this blog. It suggested adding a node package called wtfnode wtfnode - npm (npmjs.com). Unfortunately, this didn’t seem to work, the author of the package does say that this package is using undocumented Node apis and could break without warning.
After a few more weeks of Googling, I came across this package samswen/lambda-emfiles: solve node AWS lambda EMFILE issue (github.com). This package handles the EMFILE issue a different way, it causes the Lambda process to exit with a status code of 1. This means that lambda throws away the current lambda environment and starts a new one. While it didn’t fix the issue it meant that we didn’t get the retries when a process ran out of file descriptors. I did a little poking around in the source code of this package to see how it was working out the number of open file descriptors. What I found was
The thing that supprised me was that the Lambda run time has access to the /proc virtual directory. I guess that makes sense as it is running on Linux.
Having found this I had a play around on my machine to see what information you could get. I found that ls -l returned
After finding this we added some more logging to the lambda to record this before the process finished and what we found was the number of tmp files kept increasing. We now had out smoking gun.
Now that we knew what we were looking for I had a look to check that our code wan’t creating temp files, and we weren’t.
Then I started having a look at the Cloudant couchbackup library that we use. The first thing I noticed was in their package.json they referenced a package tmp, so it looks like they use tmp files. Next, I looked for references to that package and found
Ok, so firstly does this get called when we use their backup function and secondaly what does it do? More digging and I found it is aliased app.js and it is called in the backup function.
// if there is an error writing to the stream, call the completion // callback with the error set addEventListener(listenerErrorIndicator, targetStream, 'error', function(err) { debug('Error ' + JSON.stringify(err)); if (callback) callback(err); });
opts = Object.assign({}, defaults(), opts);
Right, so it is called in the path we are using what does it do? Next, I dig into the tmp package.
The first thing I noticed was on line 15 it is opening a file and then on like 18 is closes the file only if you pass in opts.discardDescriptor === true. That looks like the issue!!
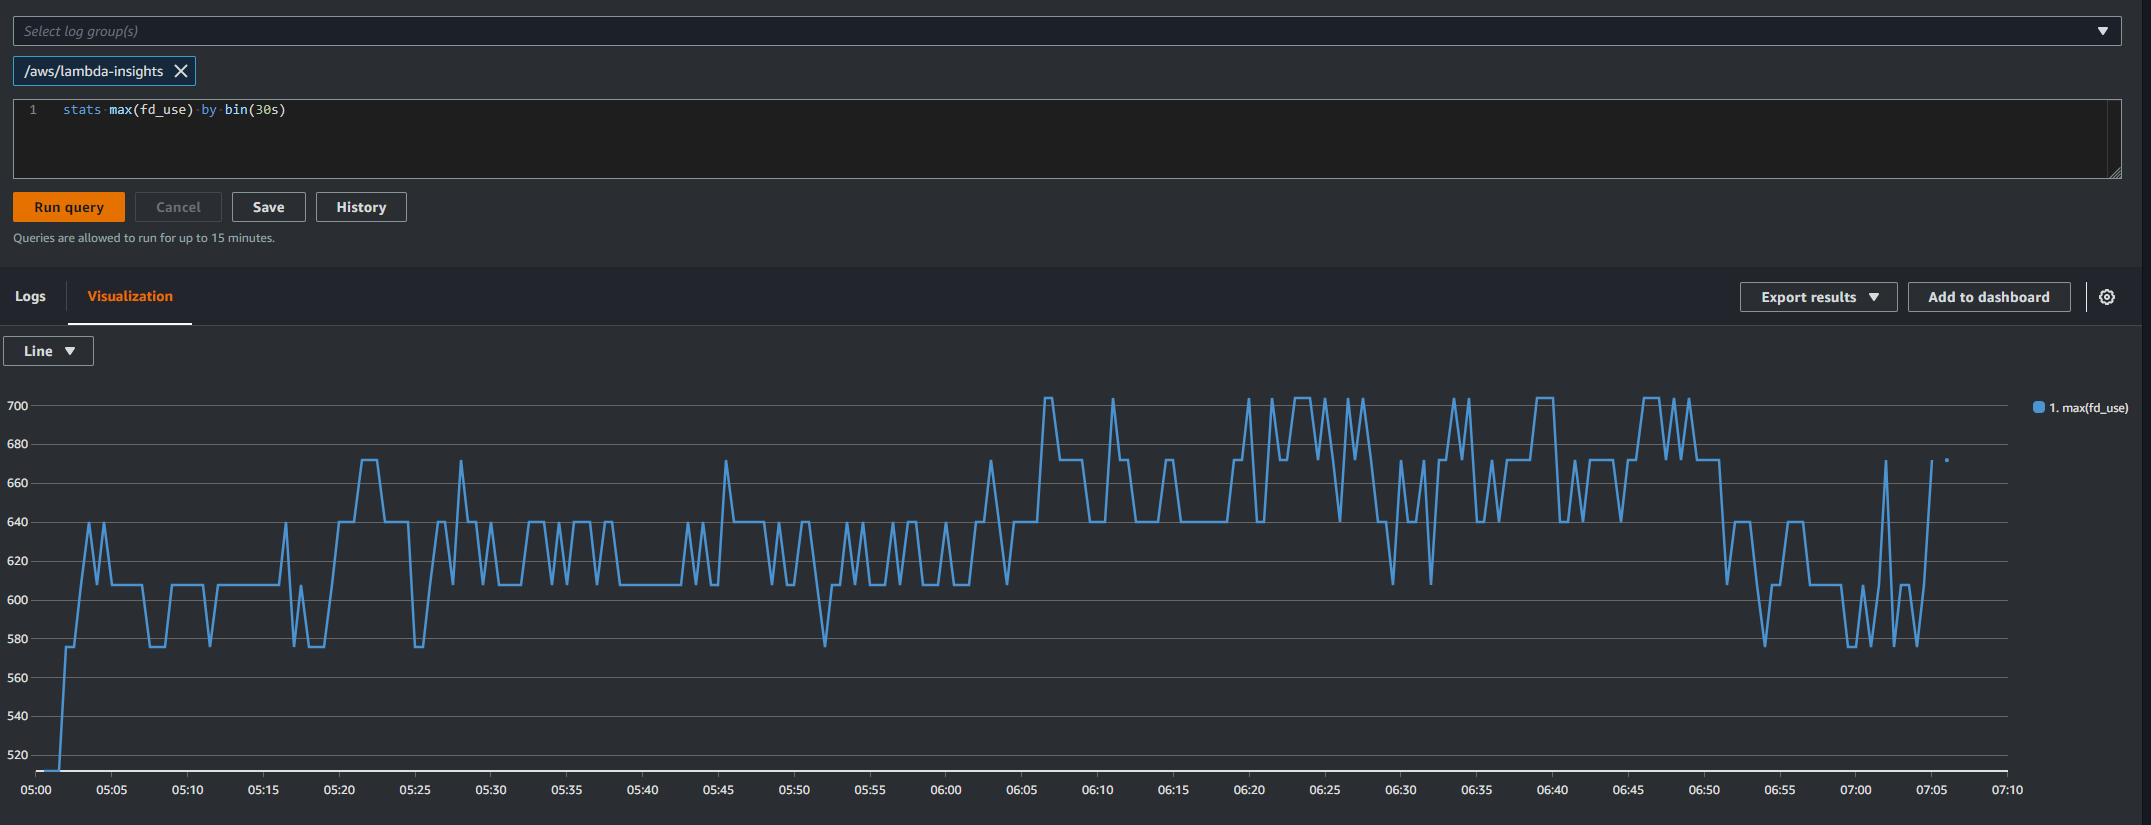
Lastly before raising an issue with Cloudant I wanted to test it, so in our couch-backup lambda I went into the node_modules folder, found the Cloudant code and changed tmp.fileSync().name to tmp.fileSync({discardDescriptor : true}).name and push those changes to production.
The next day this was the graph from Lambda Insights
I stublied across this hint in my twitter feed, but forgot to book mark it. Thank you to the person that originally posted it.
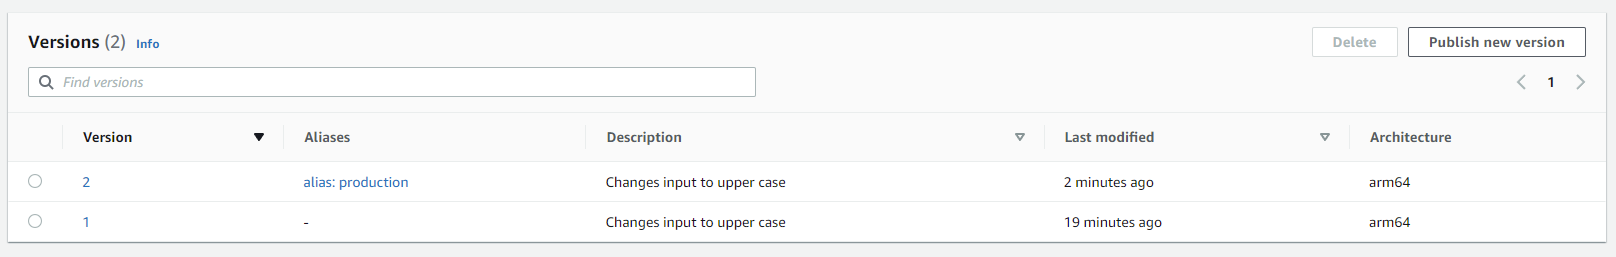
For a litte while I was trying to figure out how to stop CDK from deleting old lambda version so you could roll back quickly. Turns out it is very simple, you just need to set the rentention policy of the version to retain.
1
2
3
4
5
6
7
8
9
10
11
var function = new Function(this, "example-lambda", new FunctionProps { <other set up code> CurrentVersionOptions = new VersionOptions { RemovalPolicy = RemovalPolicy.RETAIN } }
var version = function.CurrentVersion; version.AddAlias("production");
publicvoidVisit(IConstruct node) { if (node is Stack stack) { foreach (var requiredTag in _requiredTags) { if (!stack.Tags.TagValues().ContainsKey(requiredTag)) { Annotations.Of(node).AddError($"Missing required tag {requiredTag} on stack with id {stack.StackName}"); } } } } }
But when I ran CDK synth I got this error
1 2
Unhandled exception. System.ArgumentException: Could not convert argument 'DeployLambda.TagAspect' to Jsii (Parameter 'arguments') at Amazon.JSII.Runtime.Deputy.DeputyBase.<>c__DisplayClass20_0.<ConvertArguments>b__0(Parameter parameter, Object frameworkArgument)
After a bit of Googling I found there is a known issue with an easy fix. You just need to make sure the aspect class inherites from Amazon.Jsii.Runtime.Deputy.DeputyBase
publicvoidVisit(IConstruct node) { if (node is Stack stack) { foreach (var requiredTag in _requiredTags) { if (!stack.Tags.TagValues().ContainsKey(requiredTag)) { Annotations.Of(node).AddError($"Missing required tag {requiredTag} on stack with id {stack.StackName}"); } } } } }
For a while a colleague and myself have been trying to figure out how to get a .Net lambda deployed using CDK pipelines. Unfortunately, the AWS documentation only shows how to write the pipeline in C# to deploy a Node lambda. If anyone from AWS is reading this, that isn’t a very useful example, if you are using C# for your pipeline, it is very likely that you will also want to deploy a lambda written in C#.
There was a new feature added to CDK in 2020 called bundling which seems to now be the correct way for deploying lambdas via CDK. With bunding CDK downloads an AWS container, map the source folder to that container, I then use dotnet publish which builds the code in the container. The output from the the .Net publish command is put in the containers /asset-output folder. This is used by the pipeline to get the compiled code.
var function = new Function(this, "example-lambda", new FunctionProps { FunctionName = "ToUpper-Lambda", Description = "Changes input to upper case", Runtime = Runtime.DOTNET_CORE_3_1, Handler = "ExampleLambda::ExampleLambda.Function::FunctionHandler", Architecture = Architecture.ARM_64, Code = Code.FromAsset("./ExampleLambda/", new AssetOptions { Bundling = new BundlingOptions { Image = Runtime.DOTNET_CORE_3_1.BundlingImage, Command = new [] { "bash", "-c", string.Join(" && ", commands) } } }) });
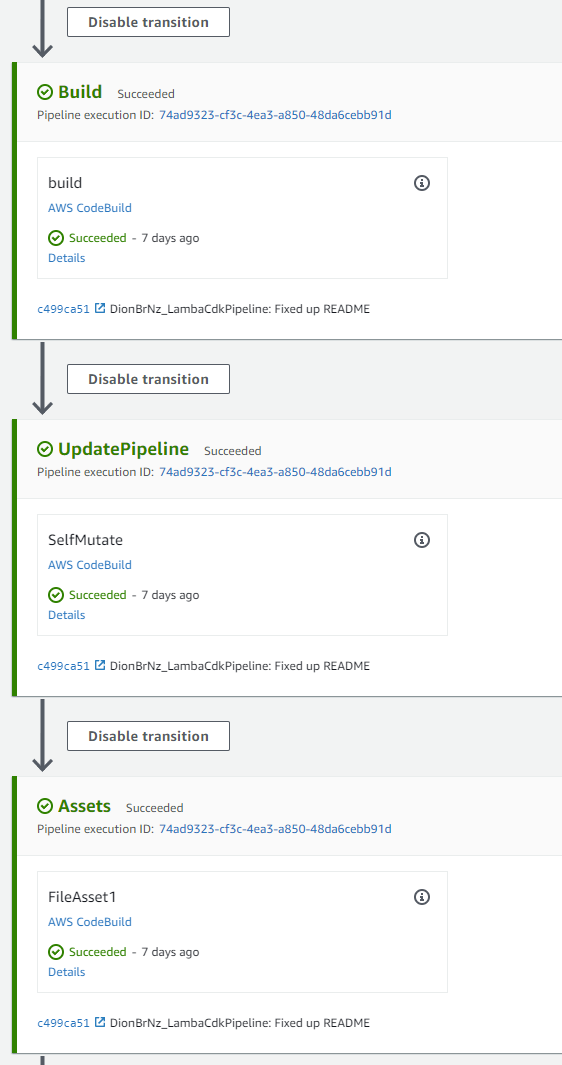
Once you have the lambda stack set up, create a stage for the lambda deployment. When this is added to the pipeline you will notice that an Assets stage is added to the pipeline.
The other thing you need to do is make sure the step that synth stack is run in a CodeBuildStep, not a ShellStep. It also needs to be privileged as this is the step that will build the lambda code inside a container as well synth the stack.
When you run the pipeline you will see the lambda is built in the build stage, then the lambda is taken from the build assets and moved into it’s one asset/s3 key so that it can be passed to the cloudformation stack that cdk creates.
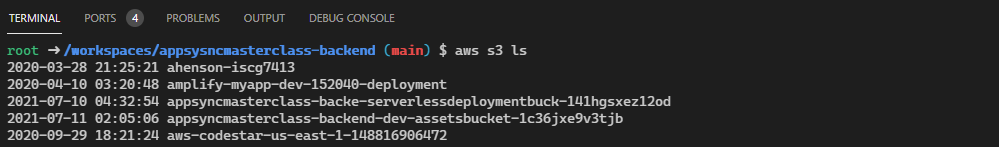
I’ve been going through the excellent AppSync Masterclass by Yan Cui. During the course I wanted to give GitHub Codespaces a try.
While Codespaces will correctly start a container with the the required node tools it doesn’t have the AWS cli which is needed for deployments from the Serverless framework. It tuns out the fix is quite simple and the Github documenation covers a lot of what you need.
The main part of it is you need to create a .devcontainer folder in your repo. Inside this folder you need a Docker file and a devcontainer.json file (Notice there is no . in the file name only in the folder name). Github has a repo with the base conatiners for the language you are using.
I used the Node container and created this Dockerfile.
1 2 3 4 5 6
ARG VARIANT=16 FROM mcr.microsoft.com/vscode/devcontainers/javascript-node:${VARIANT}
{ "name":"Node.js", "build":{ "dockerfile":"Dockerfile", // Update 'VARIANT' to pick a Node version: 12, 14, 16 "args":{"VARIANT":"16"} } }
Which is just copied from the GitHub template.
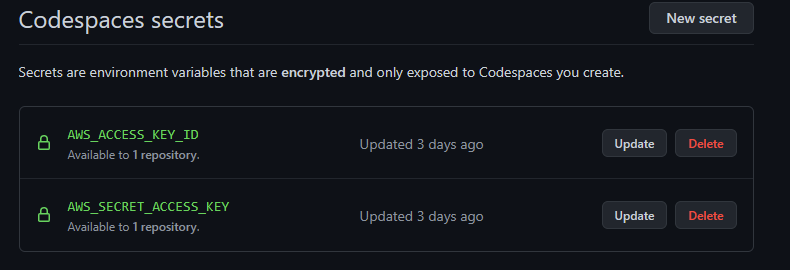
The next bit was I didn’t really want to store my credenitals in the container and GitHub and thought of that. I created to variables AWS_ACCESS_KEY_ID and AWS_SECRET_ACCESS_KEY with my credentials from AWS.
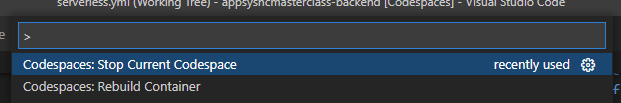
The last thing was rebuilding the CodeSpace and Restarting it, both of wich you do in VSCode from the command pallet.
During a recent production deployment of one of our applications we had an issue where containers started rolling, this was very odd as the same container had just deployed successfully to our canary environment. After the initial panic, the deployment was cancelled, and old containers started up again, panic over. Now what the heck happened?
Checking the logs, we had started getting this error.
1
2
3
4
5
6
7
8
9
10
System.IO.IOException: The configured user limit (128) on the number of inotify instances has been reached, or the per-process limit on the number of open file descriptors has been reached.
   at System.IO.FileSystemWatcher.StartRaisingEvents()
   at Microsoft.Extensions.FileProviders.Physical.PhysicalFilesWatcher.TryEnableFileSystemWatcher()
   at Microsoft.Extensions.FileProviders.Physical.PhysicalFilesWatcher.CreateFileChangeToken(String filter)
   at Microsoft.Extensions.Primitives.ChangeToken.OnChange(Func`1 changeTokenProducer, Action changeTokenConsumer)
   at Microsoft.Extensions.Configuration.FileConfigurationProvider..ctor(FileConfigurationSource source)
   at Microsoft.Extensions.Configuration.Json.JsonConfigurationSource.Build(IConfigurationBuilder builder)
   at Microsoft.Extensions.Configuration.ConfigurationBuilder.Build()
   at Microsoft.Extensions.Configuration.SystemsManagerExtensions.GetAwsOptions(IConfigurationBuilder builder)
   at Microsoft.Extensions.Configuration.SystemsManagerExtensions.AddSystemsManager(IConfigurationBuilder builder, Action`1 configureSource)
The other thing that had changed was that due to having to encrypt the clusters EBS volumes we had used this as an opportunity to upgrade the version of Linux the cluster was using.
After a little bit of Googling this appeared to be due to the reloadOnChange flag being set to true when adding our Json config files. Since we are running this in a container and containers are immutable it seemed to be an easy fix, just set reloadOnChange to false.
When we deployed the updated version, we ended up with the same exception, from the call stack it appeared that .Net was ignoring the value of the flag. Very confusing 😕.
I ended up debugging into the Microsoft code to see what was going on and found that we were using Host.CreateDefaultBuilder adds the config files itself with reload on change set to true as you can see in the code snippet below.
Microsoft was setting up the Json config files as well as our code, and theirs was defaulting to reloadOnChange. This call is pointless in our solution as we are then doing all this set up ourselves. If you read the rest of the CreateDefaultBuilder file there is stuff in there we don’t use and stuff we end up replacing, so why are we using it?
The fix was easy, change Host.CreateDefaultBuilder to new HostBuilder. Digging into the history of Host.CreateDefaultBuilder (thanks MS for putting it on GitHub), it turns out this function has worked the same way since at least .Net core 2.0. In .Net 5 they have added a flag so you can set reloadOnChange to false, but as all our applications do this type of setup themselves it is pointless to us.
The learnings from this are to check what sample code does, given that all the source for .Net core/.Net 5 is one GitHub check what the MS calls are doing. From what found it appears that we have been doing our set up wrong for a while as we end up duplicating a lot of what is in Host.CreateDefaultBuilder. Going forward I’ll be using new HostBuilder, unless I’m doing a simple app that only needs what is in Host.CreateDefaultBuilder.
It’s been 3 years already and I had to resit my Architect professional exam. This time I used the online option to do it from home which was an interesting experience.
“OpenTelemetry is created as a merger of the OpenCensus and OpenTracing projects. This project aspires to make robust, portable telemetry a built-in feature of any software. It allows you to collect low-overhead telemetry from the entirety of a modern software stack.”
I originally saw mention of OpenTelemetry on the ASP.Net core blog and then this month Jimmy Bogard started twitting about a project he was playing with, some of which he has blogged and appears to be an on going series. This got me interested in having another look at it.
What does it offer us
In short OpenTelemery allows us a consistent way of adding end-to-end diagnostics and tracing to an application, extracting away the system we are using to visualise this information. Currently there is a Alpha library for .Net https://github.com/open-telemetry/opentelemetry-dotnet which should be moving to beta shortly.
I don’t have a full example, I’ll leave that up to Jimmy as he will do a much better job, but I have some highlights below.
To configure OprnTelemetry for NewRelic we would configure it like this
AWS are starting to look at OpenTelemetry for XRay as well, but only Java so far :sad:.
Wrap up
I feel this is something that is worth keeping an eye on. It seems to have good support from vendors and is supported by the Cloud Native Computing Foundation.
If we had this when we switched from DataDog the migration would have been as simple as changing .UseDataDog to .UseNewRelic.
Recently I started having a poke around with Git Hook. The main reason for looking in to this is becuase I have a bad memory and I am always forgetting to run the unit tests before creating pushing to Github and creating a PR.
It turned out to be really easy to set up. All I needed to do was place a pre-push file into the projects .git/hooks folder.
1
dotnet test ./src/project.sln
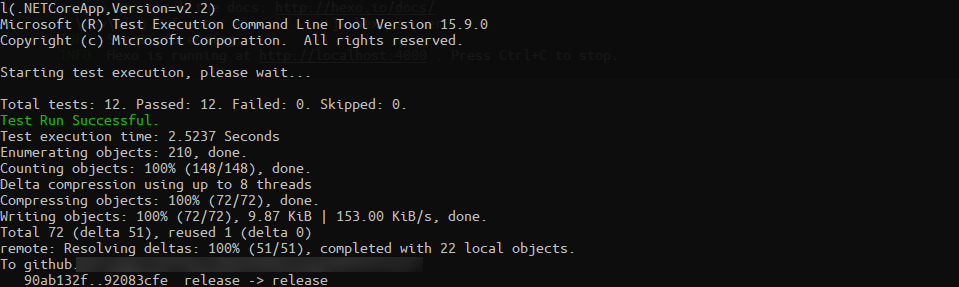
So now when a do a push from the shell
I also use the git client built in to Visual Stuido. This also seems to respect the hooks although it doesn’t give feed back on progress.